| HIFI-FORUM » English » DIY (Engl.) » Understanding & Interpreting Solid State Amplifier... | |
|
|
||||
Understanding & Interpreting Solid State Amplifier Measurements - Frequency & Power Response+A -A |
||
| Autor |
| |
|
Amp_Nut
Inventar |
#1
erstellt: 17. Feb 2007, 17:52

|
|
|
Hi Guys, As promised, I have created this thread fo discussing, and throwing some light on measurements of Solid State Amplifiers & Pre-amps. As our forum guru  on Tubes, screamgigi will, I trust, enlighten us on measurements and their interpretations on Valve amplifiers. on Tubes, screamgigi will, I trust, enlighten us on measurements and their interpretations on Valve amplifiers.1. As requested by Shahrukh, I will take the NAD C-372 Intergrated Pre+ power amplifier, as a case study. It has been reviewed by Stereophile magazine, and can be read at " http://stereophile.com/integratedamps/1006nadI would encrorage all to read the entire Stereophile review, ESPECIALLY the subjective commenst and the objective tests, at the above URL. REMINDER !  As mentioned by me in my earlier post at another thread,
The measurements for the Nad 372 are available at : http://stereophile.com/integratedamps/1006nad/index5.htmlNOTE : I am NOT a Know it all  , & I do hope that other forum members & gurus will contibute and share their knowledge & time on this thread. , & I do hope that other forum members & gurus will contibute and share their knowledge & time on this thread.This topic, specially the interpretations are ratgher empirical, so ALL Insights and experiences are welcome. Looking forward to a lively thread ! 
|
||
|
Amp_Nut
Inventar |
#2
erstellt: 17. Feb 2007, 18:22
|
|
|
FREQUENCY RESPONSE MEASUREMENTS 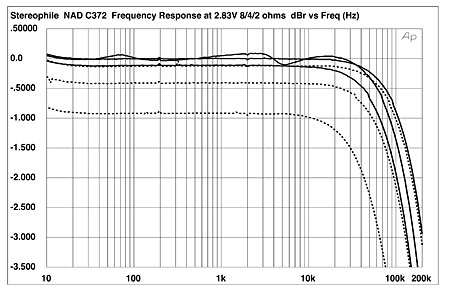 |
||
|
|
||
|
Amp_Nut
Inventar |
#3
erstellt: 17. Feb 2007, 19:05
|
|
|
Frequecy Response Measurements indicate how the output varies with frequency with ALMOST NO LOAD. If you look closely, the top of the graph says the measurements were taken at 2.83 Volts into 4 or 8 ohms. This implies that the amplifier was putting out ( a token ) 2.83 x 2.83 divide by 8 = 1 Watt . ( not much compared to its 190 Watts per channel max output with 1% distortion ) The frequency response therefore typically portraits the Best ( idealistic ) performance that the Amplifier is likely to provide on a theoritical basis, and not its ACTUAL Performance, feeding loudspeakers & delivering substantial power to the speakers. To fully understand the frequency response measurements, we need to know the following : 1. THE AUDIO SPECTRUM ( 20 Hz to 20,000 Hz ) 2. THe Decibel 3. -3 dB points 4. Logarathmic Ratios 5. The "Flat Frequency Response" 6. Any other pointer I have probably missed. Can I request other forum member to write / contibute on the above points ( 1 to 6 ) ? Enquiring minds are also invited to ask on anything I have writtten or forgotten to write about above... |
||
|
Kamal
Stammgast |
#4
erstellt: 17. Feb 2007, 19:53
|
|
|
Like I said earlier,this is going to be one of the most interesting, informative & useful of threads in a long, long time- Go Amp Go! |
||
|
Amp_Nut
Inventar |
#5
erstellt: 17. Feb 2007, 20:18
|
|
|
THANKS for your kind words of encouragement, Kamal. 1. THE AUDIO SPECTRUM ( 20 Hz to 20,000 Hz ) The Human ear is Supposed to hear sounds that range in Freq from: 20 Hz ( VERY Low, deep bass, that is often felt physically more than it is heard ) to 20,000 Hz or 20 Kilo Hertz i.e. 20 KHz (remember Kilo is an abreviation for 1000 eg Kilogram = 1000 grams) Sadly, due to thickning of the eardrum ( am I correct, doc ? ) ears more than 40 years old, rarely can hear 15 KHz or higher. OCTAVES The audio frequecy spectrum spans 10 Octaves. Each octave is a doubling of frequency. ie 20 Hz to 40 Hz 40 Hz to 80 Hz 80 Hz to 160 Hz 160 Hz to 320 Hz 320 Hz to 640 Hz 640 Hz to 1280 Hz 1280 Hz to 2560 Hz 2560 Hz to 5120 Hz 5120 Hz to 10,240 Hz ( ie 5.12 KHz to 10.24 KHz ) 10,240 Hz to 20,480 Hz ( ie 10.24 KHz to 20.48 KHz ) You will observe the the size of each octave grows at higher frequencies. THE DECADE A decade interval is also sometimes used. A decade is a x10 span of frequencies. eg , there are 3 decades between 20 Hz & 20 Khz, viz : 20 Hz to 200 Hz 200 Hz to 2 KHz 2KHz to 20 KHz Our hearing is logarathimic, and our ear responds accordingly ( more when someone addresses Log hearing / ratios ) All Hi Fi Equipment therefore strives to provide impecable performance ATLEAST for 20 Hz to 20 KHz. [Beitrag von Amp_Nut am 17. Feb 2007, 20:49 bearbeitet] |
||
|
Amp_Nut
Inventar |
#6
erstellt: 17. Feb 2007, 20:30
|
|
|
2. The Decibel The unit of sound was called a "Bell" as a tribute to Alexander Gram Bell. One tenth of a bell was where it all began.... it was the smallest change volume in level perceptible to a ( non audiophile ? ) person.This unit was called a "decibel."Strangely ( ? or have we evolved over the past 100 years or so ??  ) today, measurements get down to 0.1 decibel (dB ) and some claim to be able to hear down to that minute level.... ) today, measurements get down to 0.1 decibel (dB ) and some claim to be able to hear down to that minute level.... Hence going by the listning capabilities of our forefathers... any differences of less than 1 dB would / should be in-audible.  [Beitrag von Amp_Nut am 17. Feb 2007, 20:32 bearbeitet] |
||
|
Amp_Nut
Inventar |
#7
erstellt: 17. Feb 2007, 20:44
|
|
|
3. -3 dB points Due to the log ratio of the decibel (dB) a 3 dB change represents Half / double the power ! Hence if an amplifier is delivering 100 Watts at say 1 KHz, and is 3 db down ( i.e. Minus 3 dB i.e. -3dB ) at 20 KHz.... ...it implies that it can deliver only 50 Watts at 20 KHz. On the other hand, if your use tone controls to provide a 3 dB bass boost at 20 Hz ( i.e. +3 dB at 20 Hz ), the amp would be called on to pump out 200 Watts at 20 Hz, while delivering 100 Watts at 1 Khz. Tone controls often provide a boost or cut of 12 dB or even 20 dB. See the Tone Control graphs for the same NAD Amplifier: 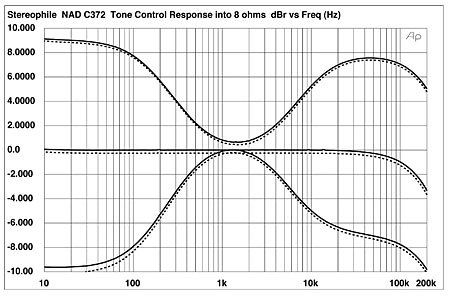 The graph above shows that the Tone controls can provide a max boost or cut of 9 dB at 10 Hz to 30 Hz Similarly, they can boost or cut 7 dB of treble at 20 KHz. Also observe in the graphs how the vertical lines are VERY unevenly spaced every decade... Far apart between say 10 and 20 and then getting progressively closer towards 70, 80 & 90. [Beitrag von Amp_Nut am 17. Feb 2007, 20:47 bearbeitet] |
||
|
Amp_Nut
Inventar |
#8
erstellt: 17. Feb 2007, 20:54
|
|
|
BACK TO THE FREQ RESPONSE GRAPH Stereophile magazine said :
Feedback, questions, or comments on all the above welcome. If you prefer some other line of explanations, let me know, [Beitrag von Amp_Nut am 17. Feb 2007, 20:56 bearbeitet] |
||
|
Neutral
Stammgast |
#9
erstellt: 18. Feb 2007, 13:04
|
|
|
Thanks Amp Nut, A good beginning to our amplifier analysis . From what I understood from your post, it would be dangerous  to use a large bass boost (as the amp would be overloaded beyond its normal power rating). Right? to use a large bass boost (as the amp would be overloaded beyond its normal power rating). Right?Corollary: Tone controls should be sparingly used? I didn't understand the part about the placement of the vertical lines. Do explain please. The published freq response graph is ideal at 1W. At higher watts, there will be aberrations (clipping), especially in the high freq spectrum. Right? Logarithmic ratios: Here's what I found on the net. Can you simplify it? What is a logarithmic scale? A ruler is a linear scale: it has marks on it corresponding to equal quantities of distance. One way of expressing this is to say that the ratio of successive intervals is equal to one. A logarithmic scale is different in that the ratio of successive intervals is not equal to one. Each interval on a logarithmic scale is some common factor larger than the previous interval. A typical ratio is 10, so that the marks on the scale read: 1, 10, 100, 1000, 10000, etc. Such a scale is useful if you are plotting a graph of values which have a very large range. Since many aspects of perception are related to proportional change, logarithmic scales are very common in psychophysics. A graph of many perceptual scales against the logarithm of the stimulus size is a straight line over some range (this is known as Weber's law). A scale of perceptual pitch against log (Hz) is a good example. What is the difference between loudness and intensity? Loudness is a perceptual or subjective quality of a sound; intensity is a physical or objective property. Although changes in intensity can cause changes in loudness, they are clearly two different scales. In particular, sounds which are below the threshold of audibility have a non-zero intensity, but zero loudness. Intensity is measured in Wm-2, but we usually prefer to use the Sound Pressure Level scale (dBSPL). Loudness can be measured in units called phons, where 10 phons is the perceived loudness associated with a pure tone of 1000Hz at 10dB above the threshold of audibility. Why do we need to multiply by 20 in the decibel scale? The number 20 has two causes: one that gives us a multiplier of 10, and one that gives us a multiplier of 2. The factor of 10 is easy - we are working in decibels not bels. One bel (named after Alexander Graham Bell, by the way) is rather a large unit, roughly equal to a tripling in amplitude. So we multiply by 10 and work in tenths of a bel to give us more sensitivity. The factor of 2 is there because we have ignored the fact that the correct definition of decibels is as a logarithmic ratio of powers not amplitudes. Why doesn't 0dB mean that nothing is measured? The decibel scale is a logarithmic ratio scale: we start with a ratio of pressures, then take the logarithm and finally multiply by 20. If the ratio is a number greater than one, then the logarithm must produce a value greater than 0 (e.g. log(10)=1). If the ratio is a number less than one, then the logarithm must produce a value less than 0 (e.g. the log(0.1)=-1). If the ratio is equal to one (i.e. that the two pressures are equal) then the logarithm returns 0 (since log(1)=0). Thus the zero point on the decibel scale is simply the point at which the measured amplitude is equal to the reference amplitude. |
||
|
Kamal
Stammgast |
#10
erstellt: 18. Feb 2007, 22:57
|
|
|
Err, of course,elementary, my dear Watson....... Seriously, I'm feeling technically drowned. Ampji, Neutralji, I beg you to please consider- you are addressing engineers as well as BA/MA guys. Alongside the Hitech stuff, plz also give simple explanations which us poor arty types can follow. Your passion for the subject of course, comes thru loud & clear. |
||
|
Amp_Nut
Inventar |
#11
erstellt: 19. Feb 2007, 06:14
|
|
|
Kamalji, If have lost you, can you please indicate where ? Specific pointers wuill help me elaborate on some points that I may have taken for granted. Sorry about that ! 
YES ! 
Clipping is an EXTREME example. An amplifier may be "Flat" ( ie amplifies ALL Frquencies EXACTLY the same, resulting in a desirable FLAT freq response as in the 1st or last graphs above ) from 20 Hz to 20 KHz, when delivering 1 Watt power. However, when delivering 80% of its output power, it may have a reduced High Freq output.... May I request others to contribute on the Log scale and related queries ? Would be VERY nice to have an interactive thread.... it will also 'Ventilate' more points and aspects of amplifier performance & measurements.... |
||
| ||

|
|
||||
| Das könnte Dich auch interessieren: |
|
DIY 300B DHT SE Amplifier Project aks07 am 14.01.2009 – Letzte Antwort am 22.02.2009 – 84 Beiträge |
|
First tube amp.help a rookie? Savyasaachi am 27.02.2009 – Letzte Antwort am 23.03.2009 – 36 Beiträge |
|
25vdc regulated power supply Manek am 26.01.2011 – Letzte Antwort am 22.05.2011 – 9 Beiträge |
|
Good Electronics text book nsanku am 24.12.2008 – Letzte Antwort am 24.12.2008 – 2 Beiträge |
|
300 watt Hi-fi power amp project. hydrovac am 19.07.2013 – Letzte Antwort am 19.09.2013 – 5 Beiträge |
|
Help identifying speaker Honda_Transalp_ am 30.09.2014 – Letzte Antwort am 25.02.2019 – 2 Beiträge |
|
The king of hybrid headphone amplifiers.EHHA Savyasaachi am 18.05.2009 – Letzte Antwort am 27.05.2009 – 5 Beiträge |
|
DIY SUB India (Bangalore) cmsajith am 03.08.2009 – Letzte Antwort am 04.08.2009 – 6 Beiträge |
|
belden 1505A coax Manek am 13.04.2008 – Letzte Antwort am 14.11.2008 – 8 Beiträge |
|
Experiments with Finolex Manek am 30.04.2007 – Letzte Antwort am 30.04.2007 – 6 Beiträge |
Foren Archiv
2007
Anzeige
Produkte in diesem Thread


Aktuelle Aktion


Partner


Top 10 Threads der letzten 7 Tage
- Hotel Modus deaktivieren
- "diese anwendung wird jetzt neu gestartet um mehr speicherplatz verfügbar zu machen"
- Von HD+ zurück zu Standard-TV
- Remotekabel anschließen, aber wie und wo?
- Hisense verbindet sich nicht mehr mit dem WLAN
- Audiodeskription ausschalten (in ZDF App) 803er
- Umschalten von TV auf Radio
- Satellitenschüssel was und wie einstellen am TV
- Pro 7 und Sat 1 auf einmal weg.
- Markierung an Lautsprecherkabel - welche Norm?
Top 10 Threads der letzten 50 Tage
- Hotel Modus deaktivieren
- "diese anwendung wird jetzt neu gestartet um mehr speicherplatz verfügbar zu machen"
- Von HD+ zurück zu Standard-TV
- Remotekabel anschließen, aber wie und wo?
- Hisense verbindet sich nicht mehr mit dem WLAN
- Audiodeskription ausschalten (in ZDF App) 803er
- Umschalten von TV auf Radio
- Satellitenschüssel was und wie einstellen am TV
- Pro 7 und Sat 1 auf einmal weg.
- Markierung an Lautsprecherkabel - welche Norm?
Top 10 Suchanfragen
Forumsstatistik
- Registrierte Mitglieder931.190 ( Heute: 2 )
- Neuestes MitgliedRox88
- Gesamtzahl an Themen1.564.905
- Gesamtzahl an Beiträgen21.871.337
